RETURN_TO_REGISTRY
One IIoT Pipeline for Mixed OT: From Serial PLCs to Native Ethernet
IIoTBrownfieldOT SecurityPLCNode-REDOPC UAGrafanaIEC 62443ModbusEdge Computing
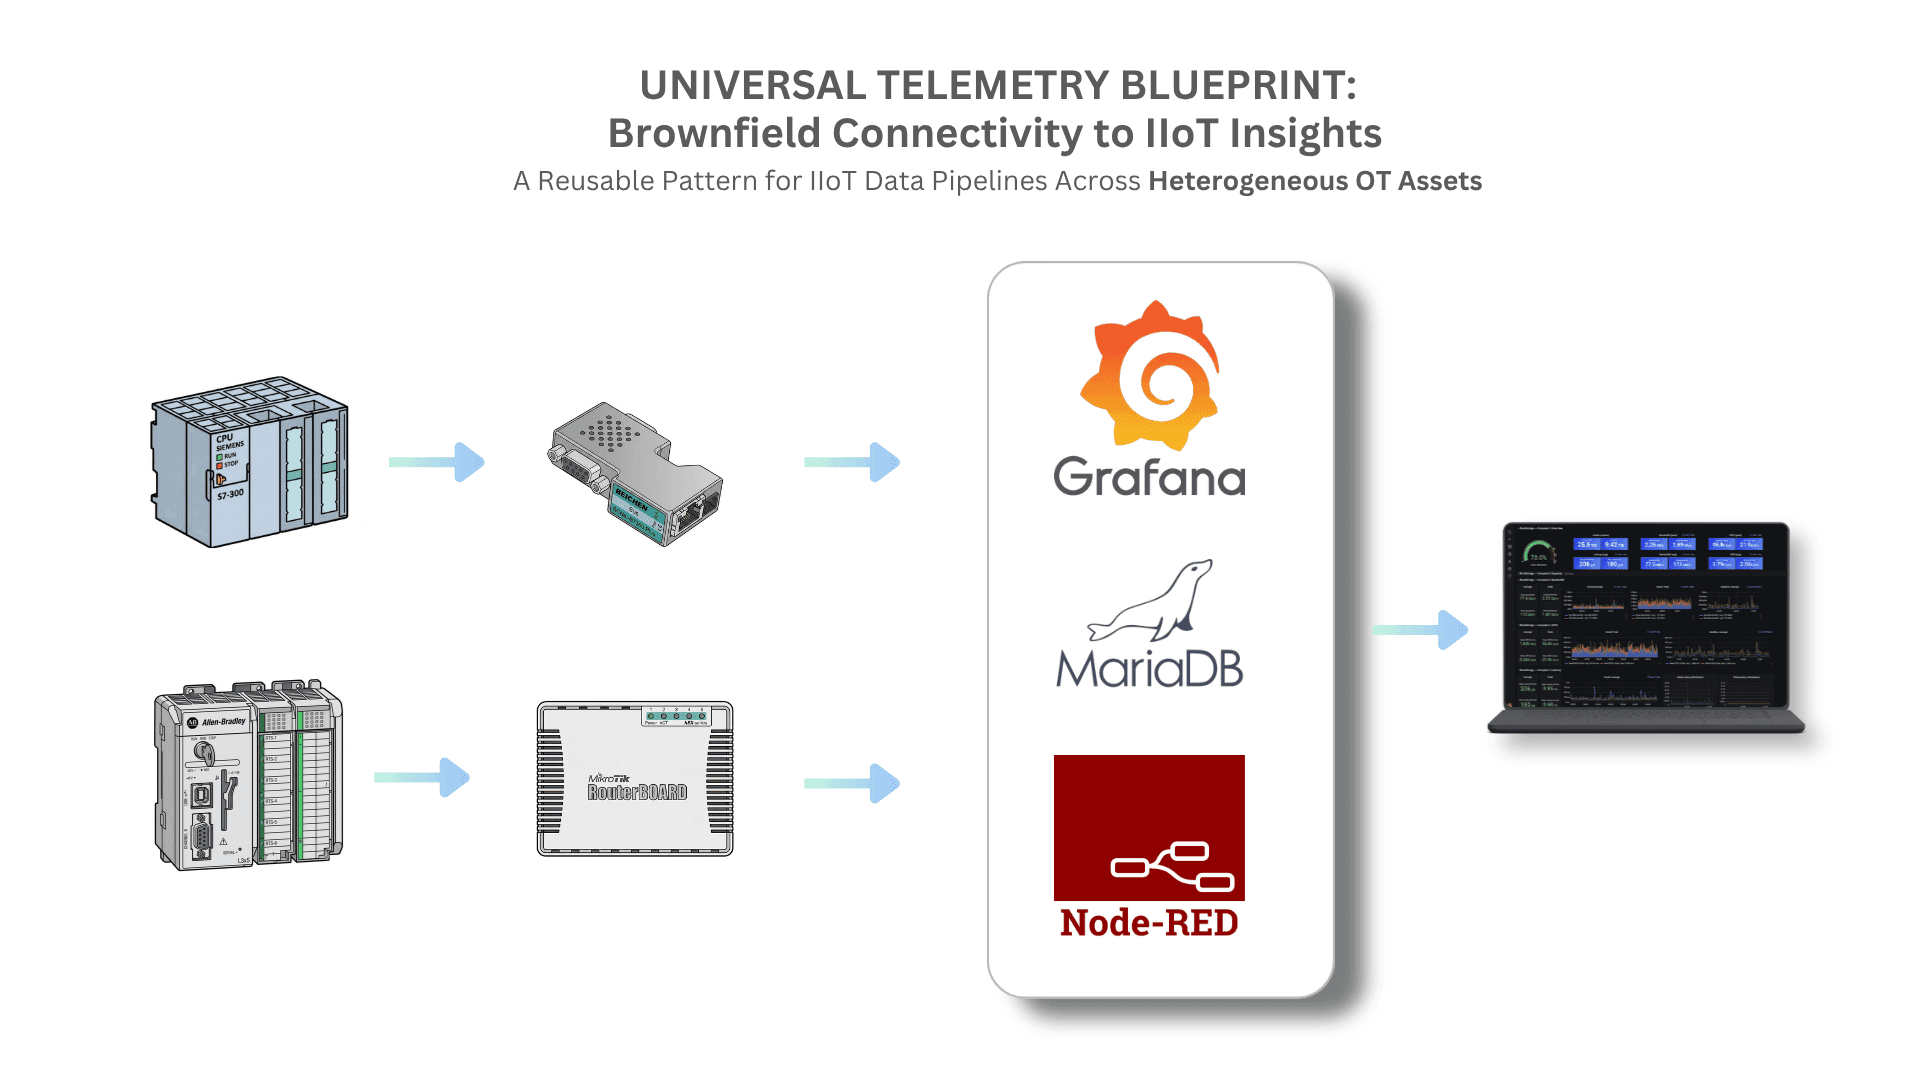
A Reusable Architectural Pattern for Extracting, Segmenting, and Normalizing OT Data Across Heterogeneous Plant Environments.
1. Executive Summary & Design Philosophy
Industrial OT environments rarely present a clean slate. Across production facilities in plastics, food & beverage, construction materials, textiles, and water/wastewater treatment, the reality is almost always a brownfield mix of legacy serial controllers, isolated machine networks, proprietary protocols, and strict downtime constraints.
When architecting an IIoT data pipeline, my core engineering principle is Open-Source & Zero-License First.
Unless a plant explicitly mandates proprietary commercial software (or already owns enterprise licenses for tools like Kepware or Power BI), my default approach deploys open-source, vendor-agnostic infrastructure. This eliminates recurring per-tag or per-node licensing fees, prevents vendor lock-in, and allows high-frequency data extraction directly over standard industrial sockets.
This article outlines a unified, 5-layer solution architecture for brownfield OT telemetry—moving from field-bus level extraction up to enterprise analytics without disrupting real-time control loops.
2. The 5-Layer Solution Architecture
Extracting field data without risking production requires clear architectural boundaries, strict network segmentation (IEC 62443), and decoupled ingestion layers.
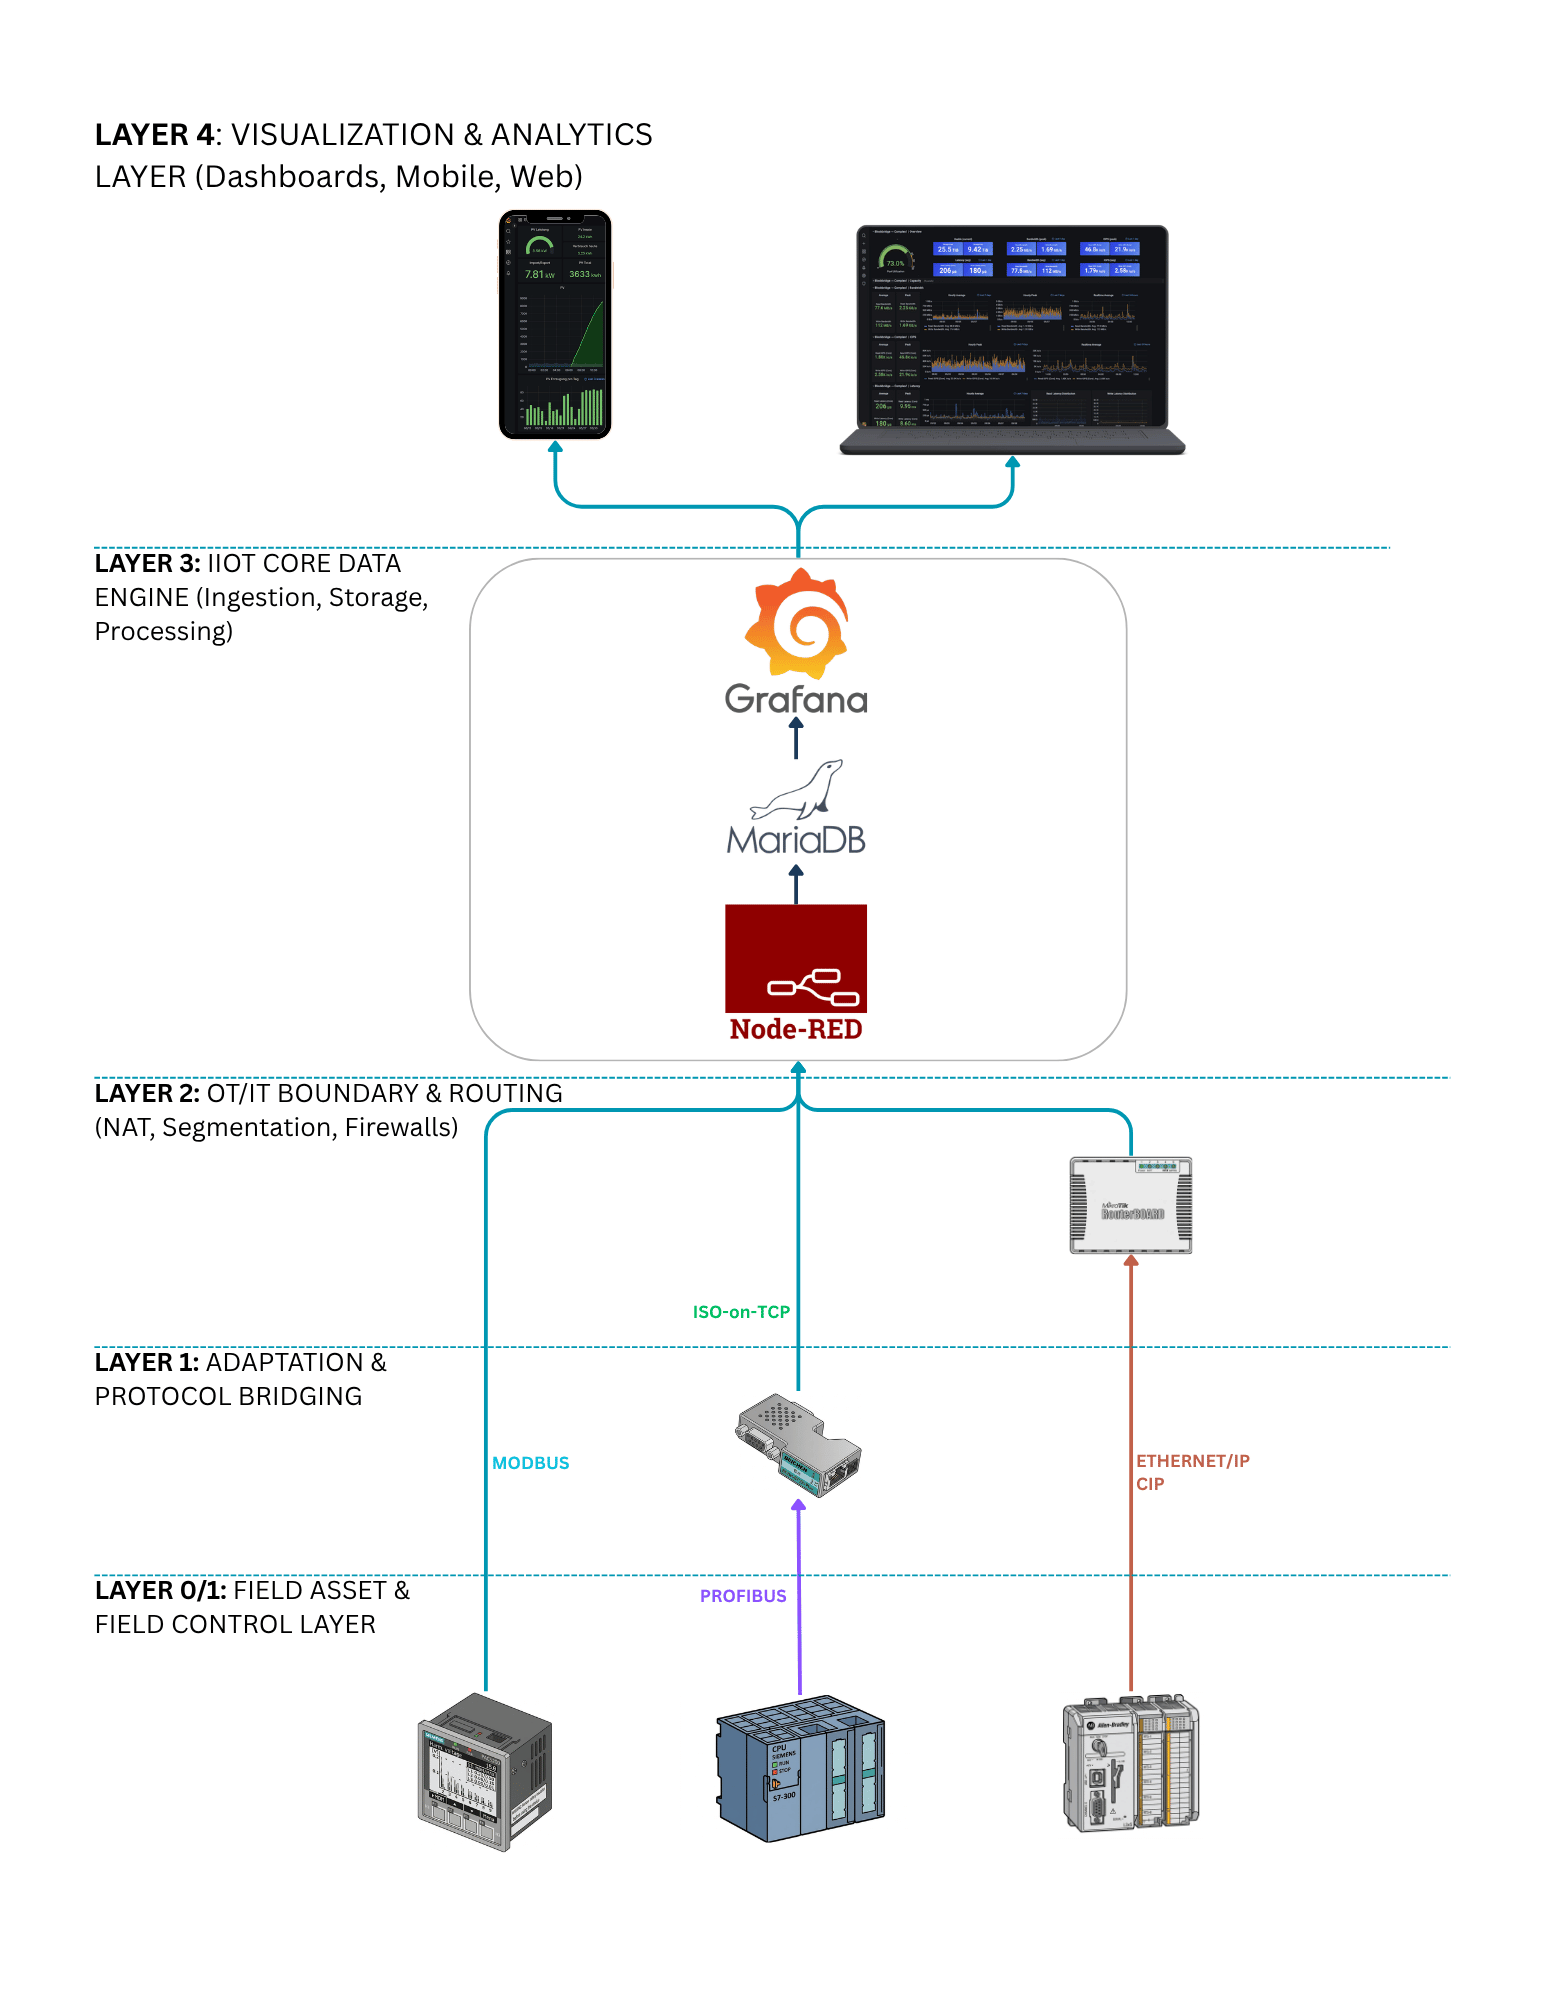 Figure 1: Solution Architecture Blueprint — Full 5-Layer ISA-95/Purdue Model
Layer 0/1: Field Asset & Control Layer
Real-time PLCs, drives, and smart instruments executing critical process loops. Deterministic execution and machine safety remain paramount—data extraction must never interfere with PLC scan cycles.
Layer 1: Adaptation & Protocol Bridging
Hardware adapters, serial converters, and physical taps used to convert legacy serial fieldbuses (PROFIBUS, MPI, Modbus RTU) into standard industrial Ethernet transports.
Layer 2: OT/IT Boundary & Security Routing
Industrial edge routers providing network isolation and address translation. This layer prevents direct IT exposure to local machine networks and eliminates IP conflict risks.
Following the IEC 62443 zone-and-conduit model, the OT/IT boundary is never a single flat firewall. Telemetry traffic crosses an industrial DMZ: an OT-facing firewall permits only the specific southbound polling sessions (e.g., S7Comm on TCP 102, EtherNet/IP CIP), a broker or gateway node sits inside the DMZ as the sole rendezvous point, and an IT-facing firewall exposes only the normalized northbound stream (OPC UA / MQTT). No control-network device is ever directly reachable from the enterprise LAN, and any file-based enterprise integration (see Section 5) drops into an SFTP staging zone inside this DMZ rather than punching a path straight into OT.
Layer 3: IIoT Core Data Engine
The central ingestion, processing, and persistence stack. It handles high-frequency polling, deadbanding, time-series data buffering, and relational mapping.
Layer 4: Visualization & Analytics Layer
Operational dashboards, HMI extensions, and web/mobile platforms delivering real-time metrics, historical trends, and executive KPIs.
3. Integration Patterns & Edge Execution
Every machine asset requires a specific integration strategy based on its native network interfaces, protocol capabilities, and plant security requirements.
Pattern 1: Non-Invasive Fieldbus-to-Ethernet Bridge
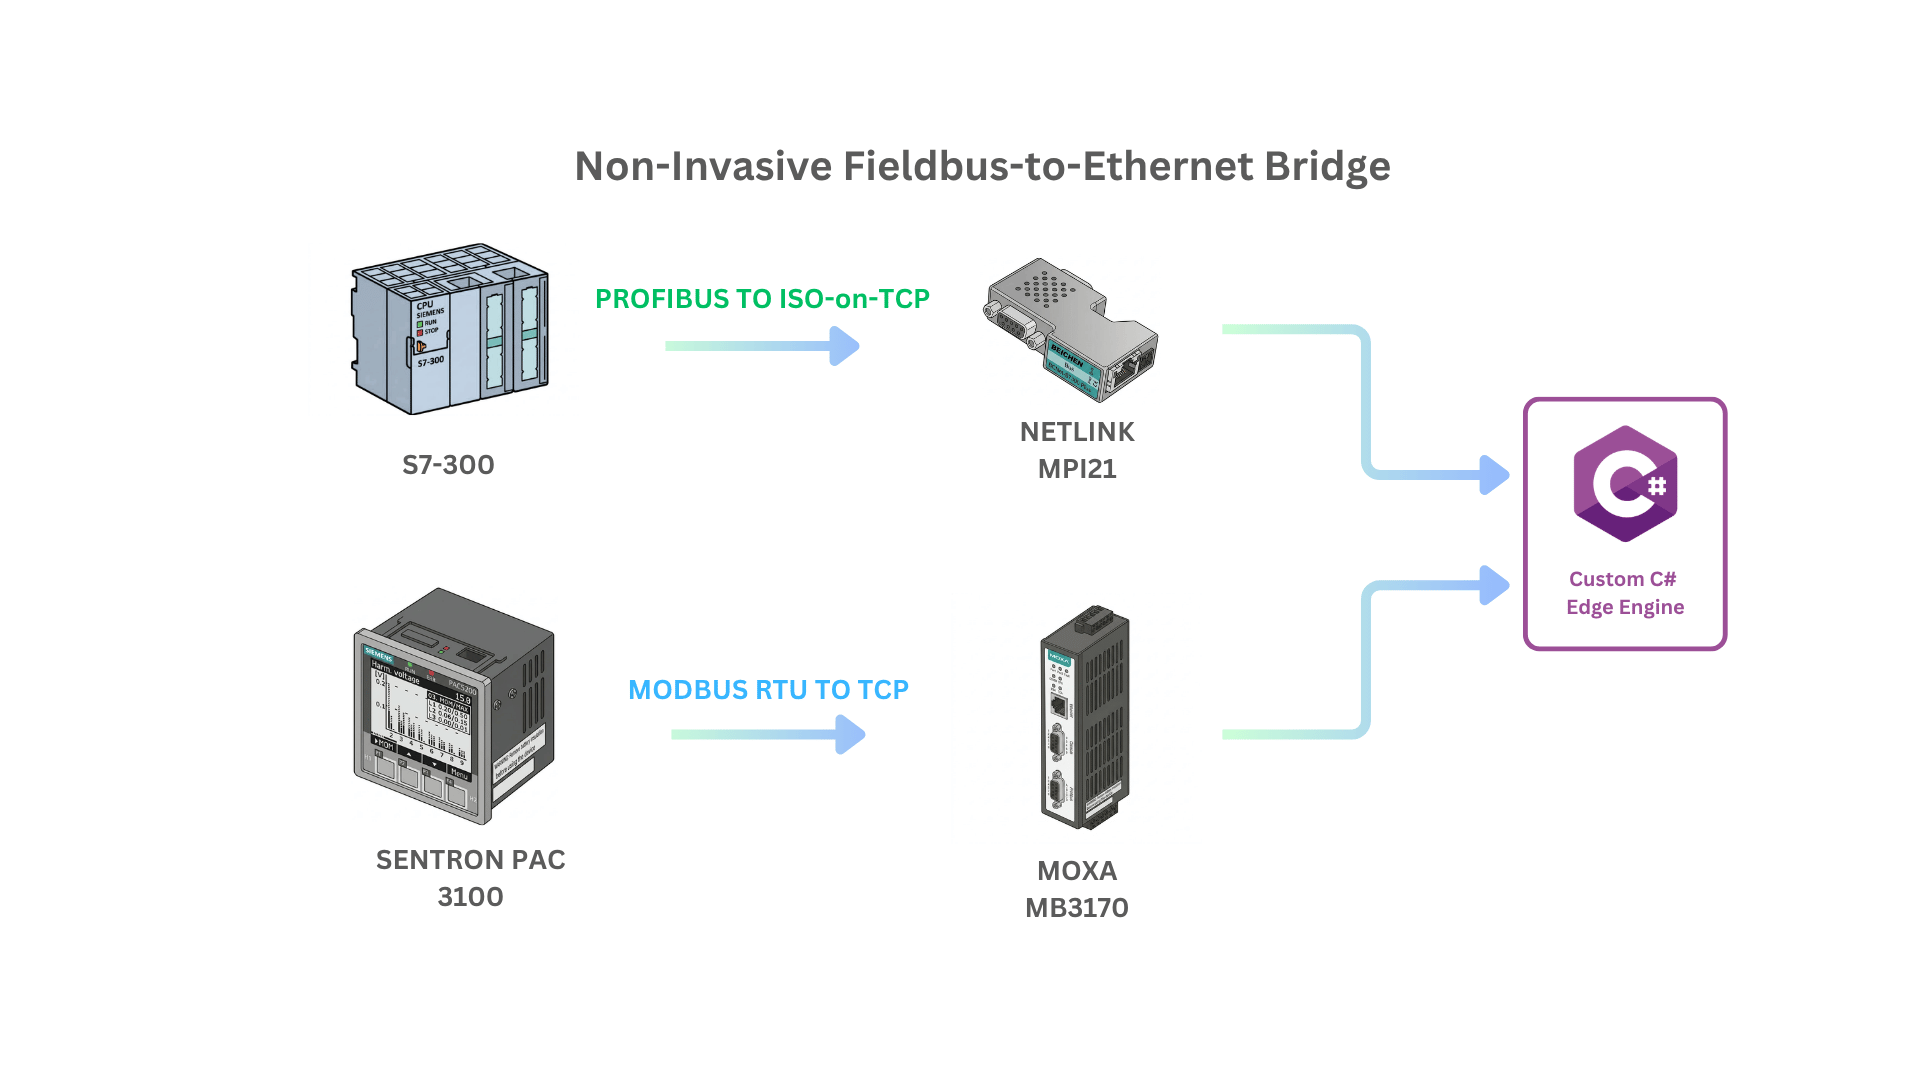 Figure 2: Non-Invasive Fieldbus-to-Ethernet Bridge (S7-300 + NETLink / Sentron PAC + Moxa)
The Challenge: Legacy PLCs (e.g., Siemens S7-300) operating on serial fieldbuses (PROFIBUS-DP/MPI) without native Ethernet cards. Installing Ethernet communication modules (CP cards) often requires stopping the PLC, modifying hardware configurations, and taking risky downtime on critical drives (e.g., 500+ HP VFDs in extrusion or water pumping lines).
The Architectural Solution: Attach a passive pass-through adapter (such as a Helmholz NETLink PRO) directly to the DB9 service/PG port. The gateway translates PROFIBUS/MPI to ISO-on-TCP (RFC 1006) over Ethernet. This allows the ingestion engine to poll data blocks directly on TCP Port 102 via standard S7Comm telegrams—with zero PLC code edits and zero CPU stops.
Pattern 2: Zero-Disruption IP Segmentation via Network Translation (PAT/NAT)
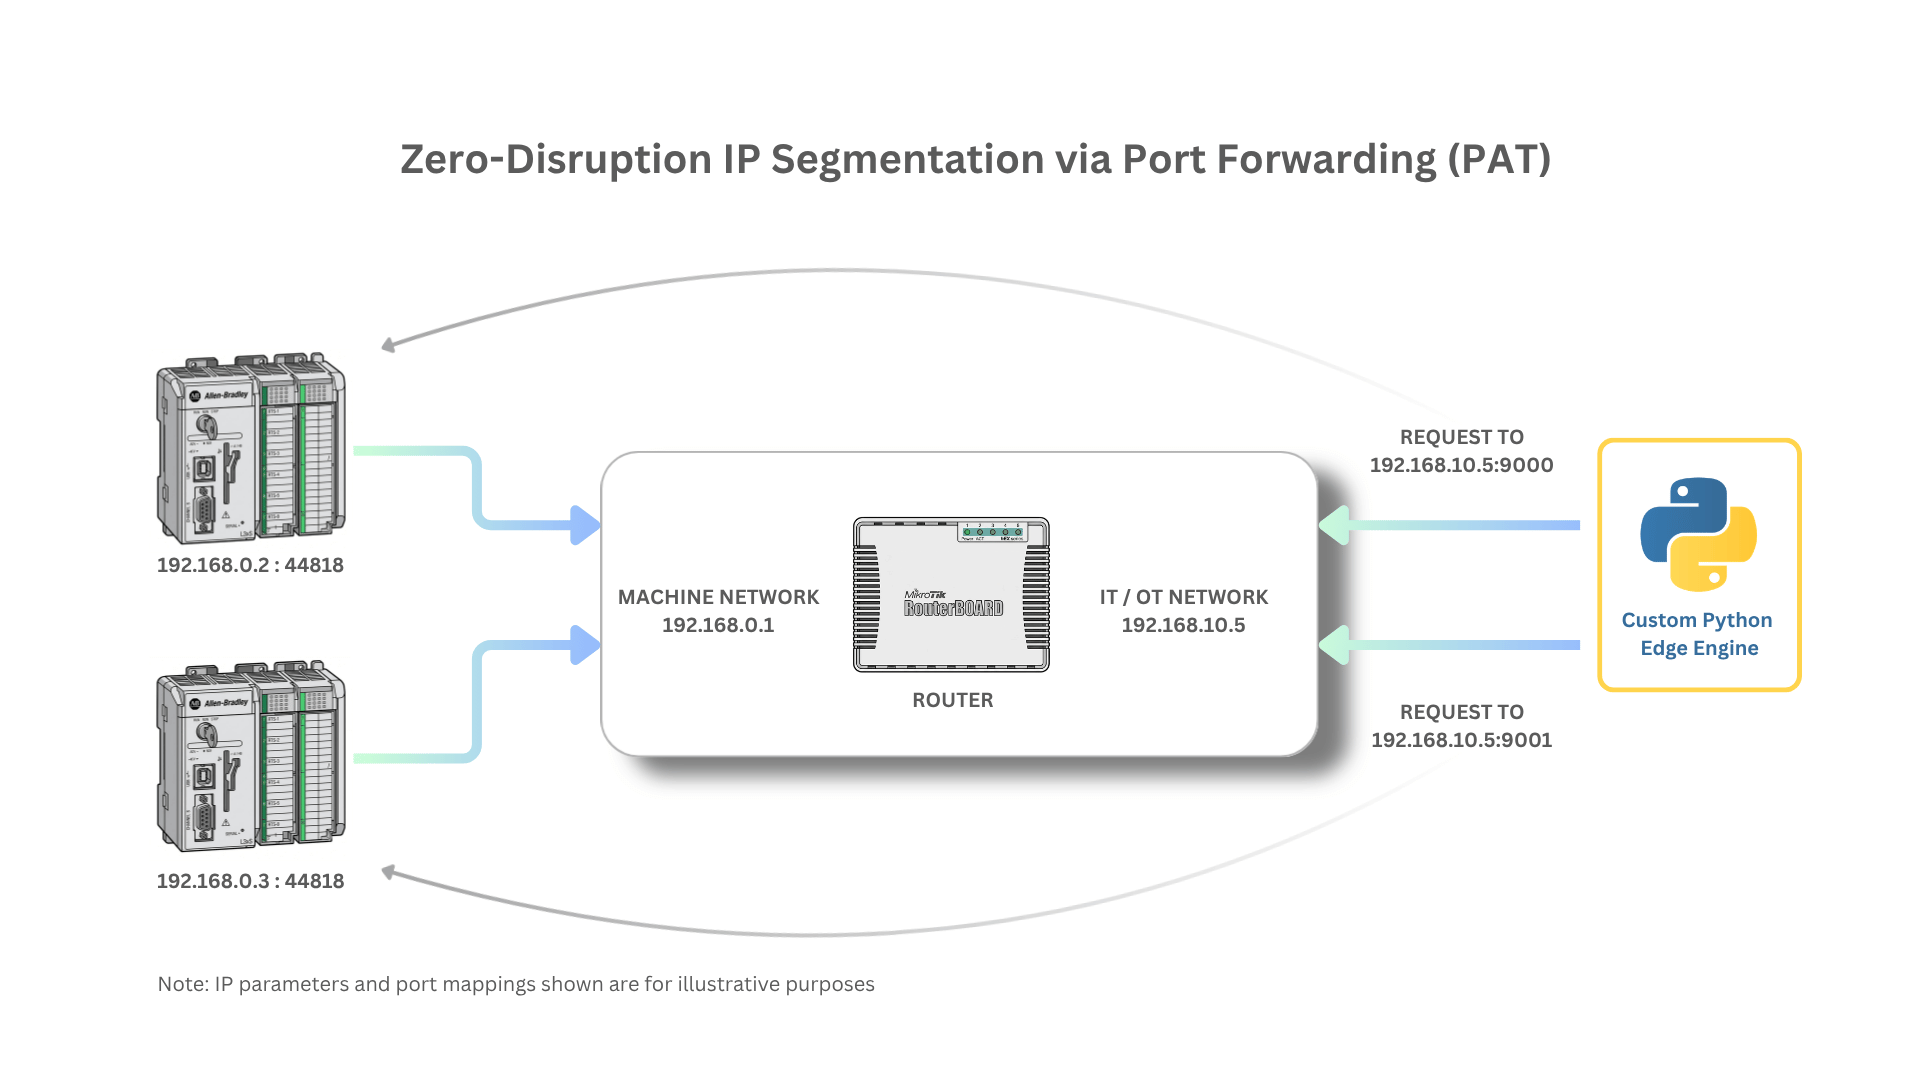 Figure 3: Zero-Disruption IP Segmentation via Port Forwarding (PAT)
The Challenge: Standalone OEM machine cells (e.g., multi-PLC Allen-Bradley CompactLogix lines) running on hardcoded, overlapping 192.168.X.X local subnets. Re-addressing these subnets causes downtime, breaks HMI target paths, and risks voiding OEM warranties.
The Architectural Solution: Deploy an edge router appliance (such as a MikroTik) as a security conduit between the local machine network and the upper OT telemetry network. Using Port Address Translation (PAT) or 1:1 NAT, internal PLC endpoints (192.168.0.2:44818) are mapped to unique virtual endpoints on the WAN side (192.168.10.5:9000). The ingestion engine polls the virtual port over standard EtherNet/IP CIP, while the machine network remains completely isolated.
Pattern 3: Direct Native Ingestion
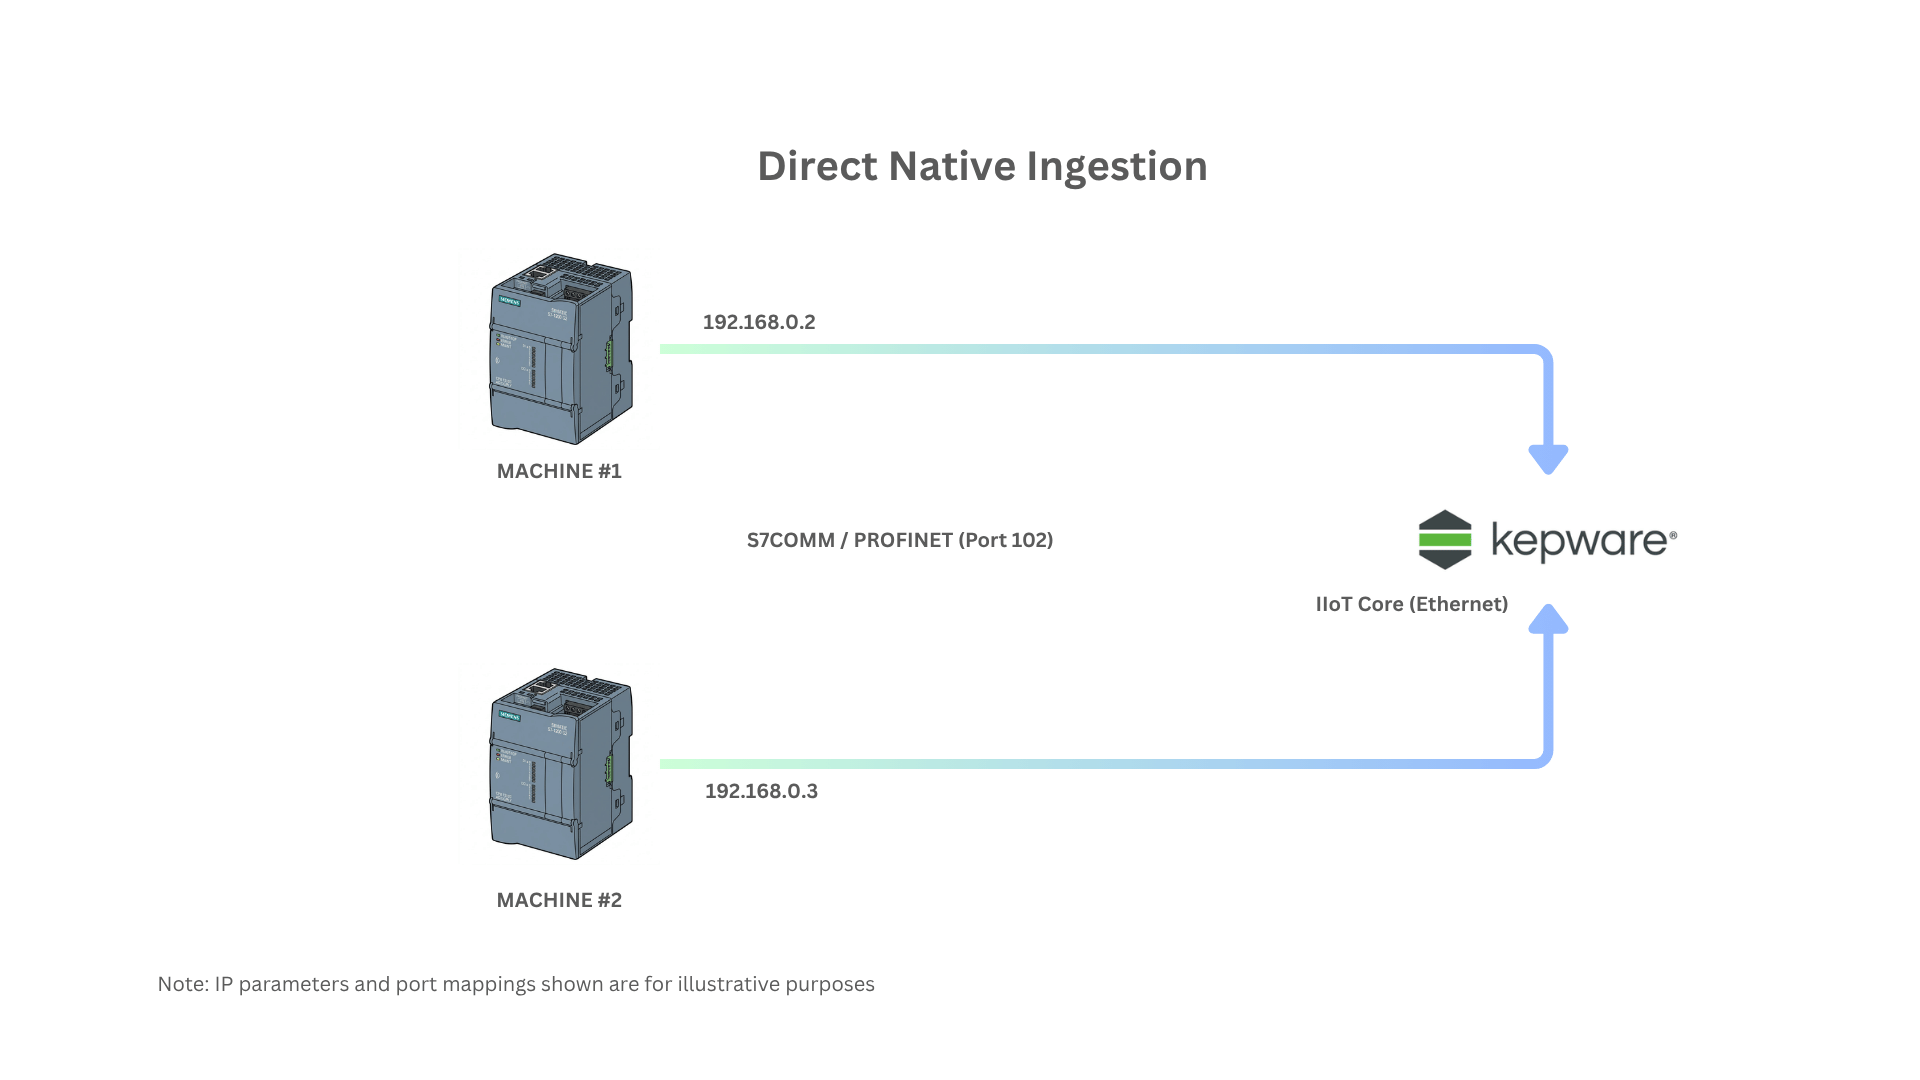 Figure 4: Direct Native Ingestion (S7-1200 / S7-1500 directly to Ingestion Engine)
The Challenge: Modern, network-ready PLCs and smart power meters (e.g., Siemens S7-1200/1500, Sentron PAC series) that already reside on standard industrial Ethernet VLANs.
The Architectural Solution: Avoid over-engineering. Poll these assets directly over native Ethernet industrial protocols (S7Comm, PROFINET, Modbus TCP) without intermediate converter hardware, maximizing throughput and minimizing points of failure.
Pattern 4: Enterprise Standardization & Edge Protocol Normalization
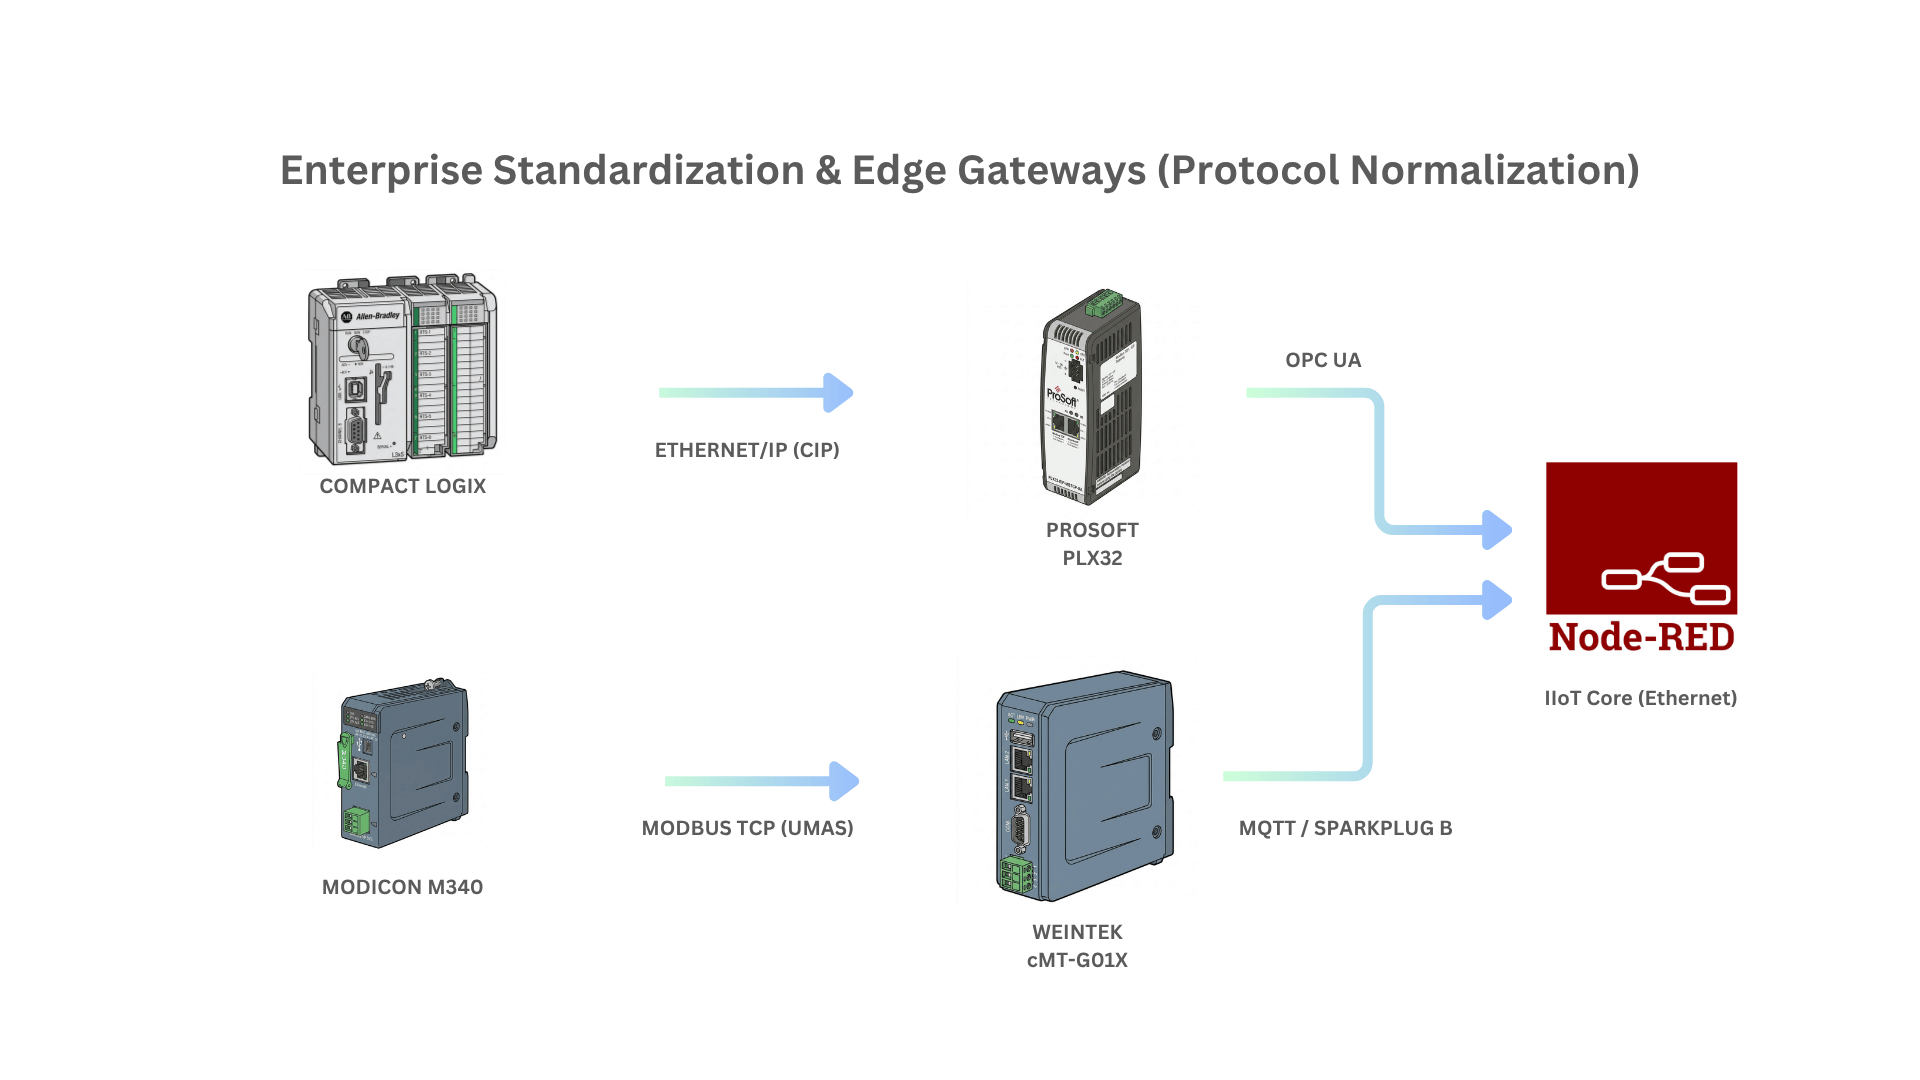 Figure 5: Protocol Normalization & Edge Gateways (ProSoft / Weintek to OPC UA & MQTT Sparkplug B)
The Challenge: Enterprise IT/OT standards requiring a single, standardized northbound data format across multi-vendor PLCs (Allen-Bradley, Schneider, Omron).
The Architectural Solution: Deploy edge protocol converters (e.g., ProSoft PLX gateways or Weintek cMT series) to convert proprietary southbound communications (such as Schneider Modbus TCP/UMAS or Rockwell EtherNet/IP CIP) into unified northbound standards like OPC UA or MQTT Sparkplug B for report-by-exception pub/sub architectures.
4. Ingestion Engine Versatility: A Polyglot Architecture
A core strength of this blueprint is that the field transport layer is completely decoupled from the ingestion language. Depending on project requirements, performance needs, or existing software infrastructure, data ingestion engines can be deployed across multiple technology stacks:
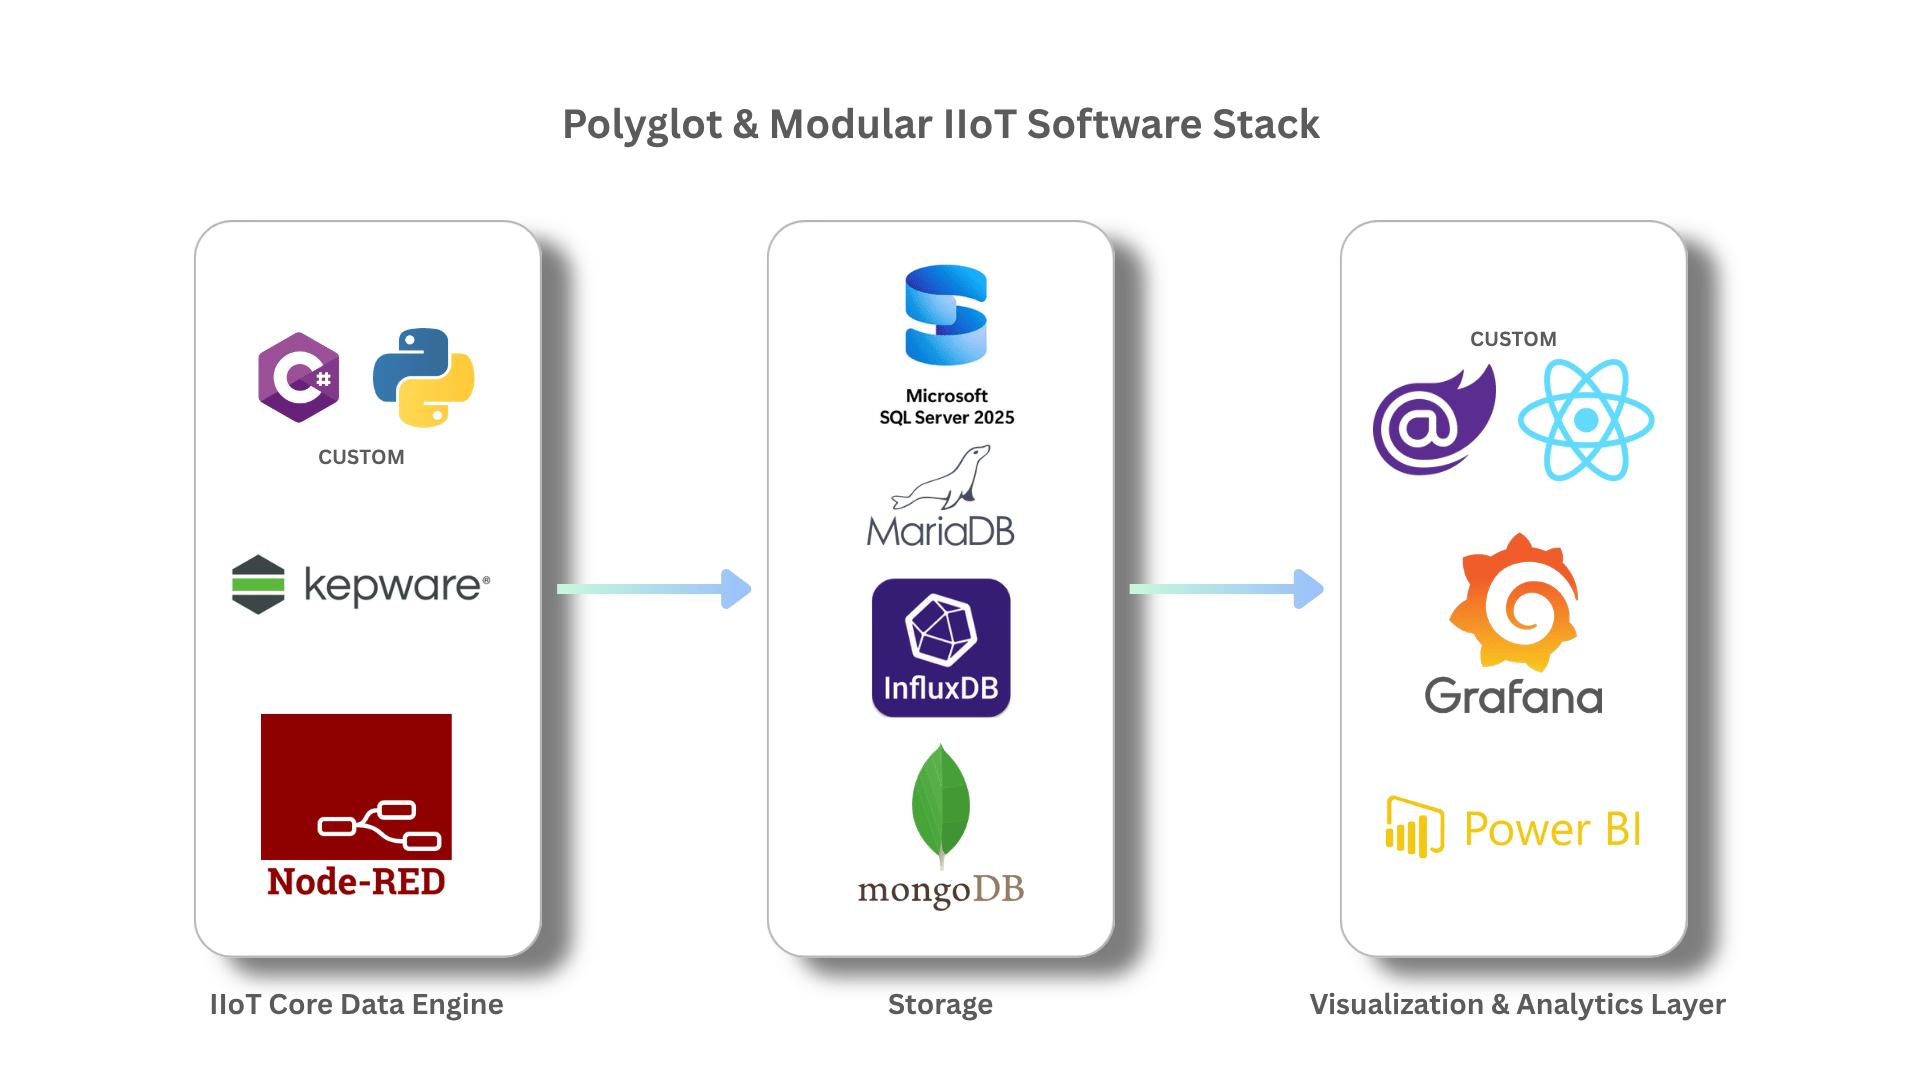 Figure 6: Technology Spectrum — Ingestion, Storage & Presentation Layers
High-Performance Custom Drivers (C# / .NET)
When to Use: Sub-second polling, high-throughput array processing, custom memory management, and compiled background services running as headless Linux systemd services or Windows Services.
Open Source Driver Ecosystem: S7NetPlus (Siemens S7), libplctag (Allen-Bradley CIP), NModbus (Modbus TCP/RTU).
Edge Analytics & Data Science Pipelines (Python)
When to Use: Rapid script deployment on Linux industrial PCs, edge AI/ML preprocessing, lightweight edge nodes, and seamless integration with data science workflows.
Open Source Driver Ecosystem: python-snap7 (Siemens S7), pycomm3 (Allen-Bradley CIP), pymodbus (Modbus TCP/RTU).
Enterprise MES & Java Environments (Java)
When to Use: Plants with established Java/Spring Boot enterprise backends or legacy SCADA integrations.
Open Source Driver Ecosystem: Apache PLC4X (Universal PLC driver framework), Eclipse Milo (OPC UA).
Event Orchestration & Rapid Prototyping (Node-RED)
When to Use: Low-code event wiring, HTTP/REST API endpoints, quick payload transformations, and visual pipeline monitoring.
Commercial Enterprise Middleware (Kepware / KepServerEX)
When to Use: When corporate policies explicitly require vendor-backed SLA support, or when a plant already owns site licenses for commercial OPC servers.
5. Storage, Visualization & Enterprise Integration
Storage follows a hybrid persistence pattern tailored to data types:
Relational metadata — MariaDB / PostgreSQL / MS SQL. Asset hierarchies, recipe parameters, shift rosters, and batch logs.
High-frequency telemetry — InfluxDB / TimescaleDB. Sensor time-series, process trends, and historical analytics.
Unstructured payload buffers — MongoDB. Changing-schema metric dumps and raw JSON machine logs.
Visualization & Consumption Tiers
A key design decision is that the storage layer is deliberately decoupled from consumption—each audience gets the right tool without duplicating the pipeline. Three distinct tiers cover the operator, the analyst, and the product/end-user.
• Open-Source Operational Dashboards (Grafana): Real-time, high-frequency time-series dashboards for the plant floor and engineering teams, with zero per-user seat fees. This is the default tier and sits closest to raw telemetry.
• Business Analytics & Executive Reporting (Power BI): For KPI aggregation, cross-domain reporting, and management-facing dashboards, Power BI connects to the relational tier (MS SQL / MariaDB) via DirectQuery or scheduled import. This serves the analytical/business audience—shift efficiency, energy cost, OEE roll-ups—on a refresh cadence measured in minutes or hours rather than sub-second.
• Custom Enterprise Portals: Tailored web applications built with C# Blazor or React for embedded, white-label, or workflow-specific interfaces, mobile monitoring, and bespoke customer-facing product experiences.
Enterprise / ERP Integration (SAP via SFTP)
Beyond visualization, telemetry frequently needs to reach transactional business systems. Rather than coupling OT directly to the ERP, aggregated production and consumption data (never high-frequency raw telemetry) is written to a structured file—CSV or an IDoc-friendly layout—by the edge engine or Node-RED, and dropped into an SFTP staging zone inside the OT/IT DMZ. SAP then ingests these files on its own batch schedule.
This file-drop pattern is a deliberate architectural choice, not a limitation. It decouples plant-floor availability from enterprise-system availability: if the ERP is offline or under maintenance, files simply accumulate in the staging zone and are processed later, while OT data collection continues uninterrupted. It also keeps a clean security boundary—no direct network path from the control network into the enterprise ERP.
6. Real-World Field-Proven Deployments
This architecture pattern is not theoretical—it has been deployed and validated across diverse industrial sectors:
• Plastics Industry: Non-invasive telemetry extraction from legacy extruder PLCs and 500+ HP main drives without interrupting active extrusion lines.
• Food & Beverage: High-throughput batch tracking and temperature telemetry persistence across multi-zone processing lines.
• Construction Materials: Aggregation of energy meters (Sentron PAC) and heavy equipment PLCs across dusty, electrically noisy field environments.
• Textile Manufacturing: Multi-PLC line synchronization and speed monitoring using 1:1 NAT segmentation across identical machine subnets.
• Water & Wastewater: Remote telemetry monitoring of isolated pumping stations over cellular/NAT routers back to central database clusters.
Conclusion
Building robust IIoT data pipelines in brownfield environments does not require expensive multi-vendor software suites or risky machine overhauls.
By applying non-invasive protocol bridging, strict network isolation via NAT/PAT, a defense-in-depth OT/IT DMZ, and an open-source polyglot ingestion layer, industrial engineers can unlock plant-floor data safely, reliably, and cost-effectively—delivering it all the way from the sensor to the operator dashboard, the business analyst, and the enterprise ERP.

Oscar Calix
Sr, Control System Engineer
Cloud computing for OT, industrial data pipelines, SCADA supervision, full-stack tools for automation workflows..